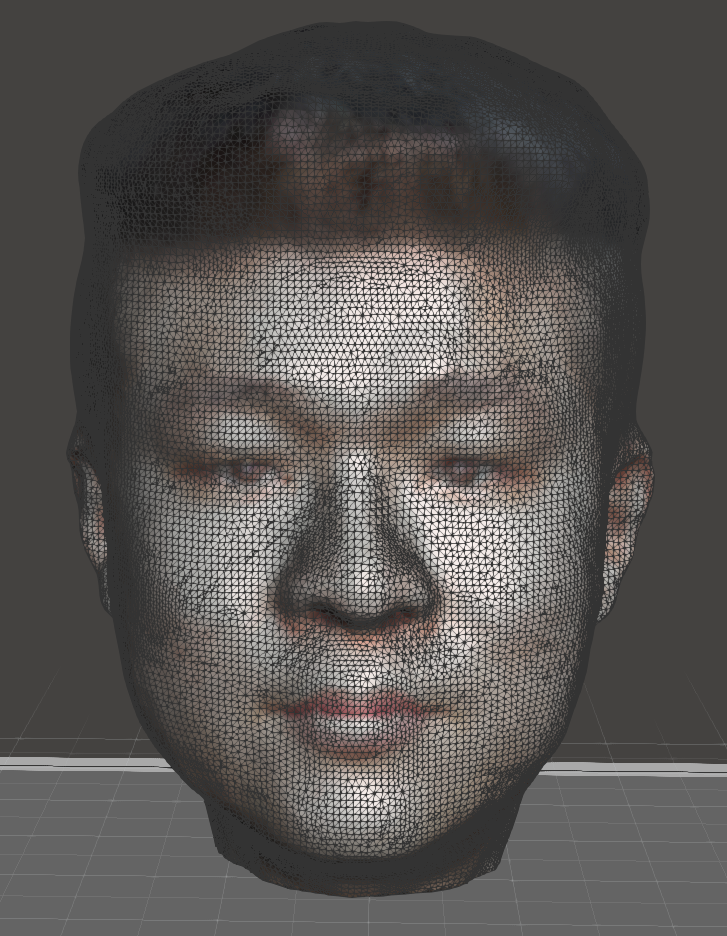
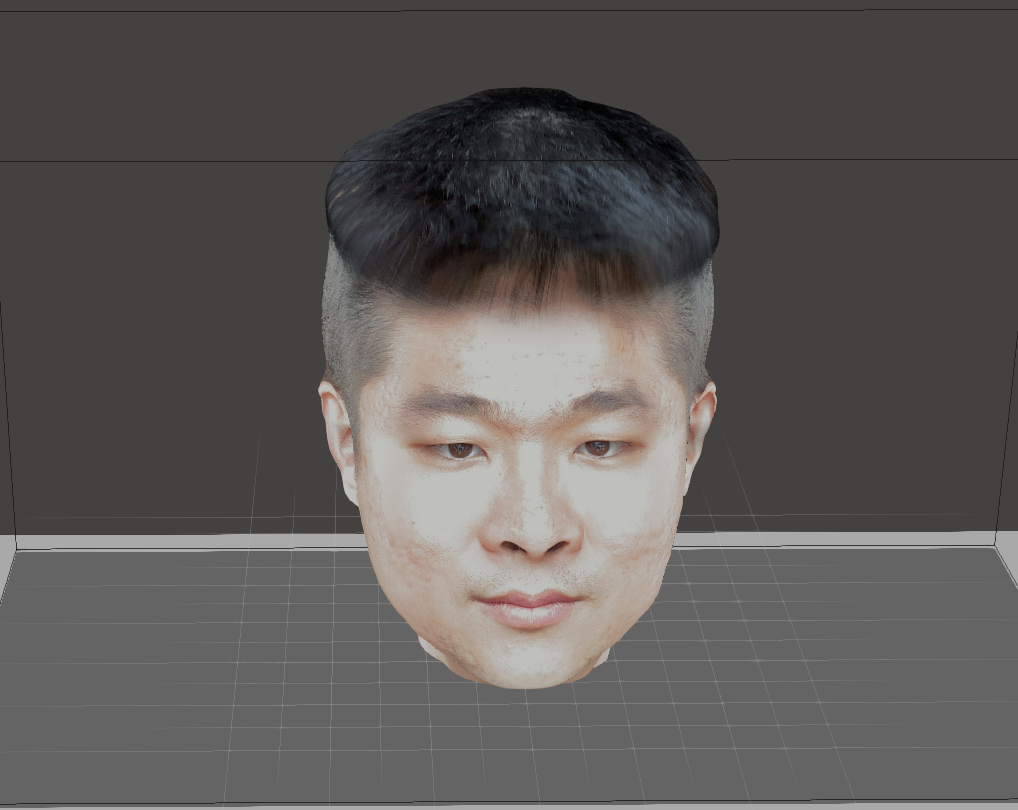
A useful tool was recommended to me by a former coworker who works at this new startup called Bellus3d. They use the depth sensor in the iPhone (with face ID logins) along with the camera and generate this model. Their app looks good. Easy to use.

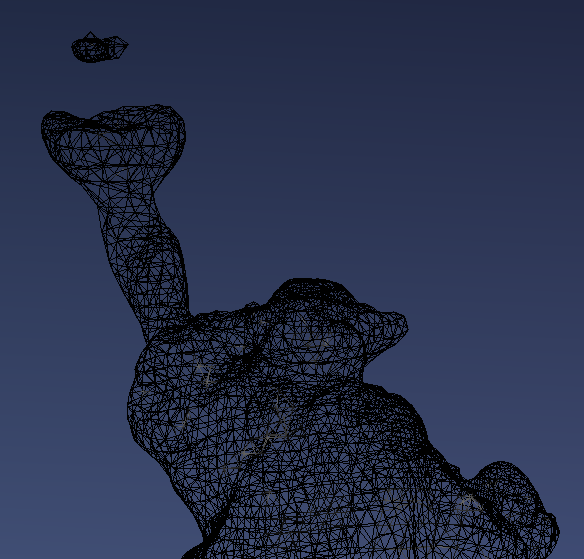
They had a web UI to view the model in 3D. You can move it around.
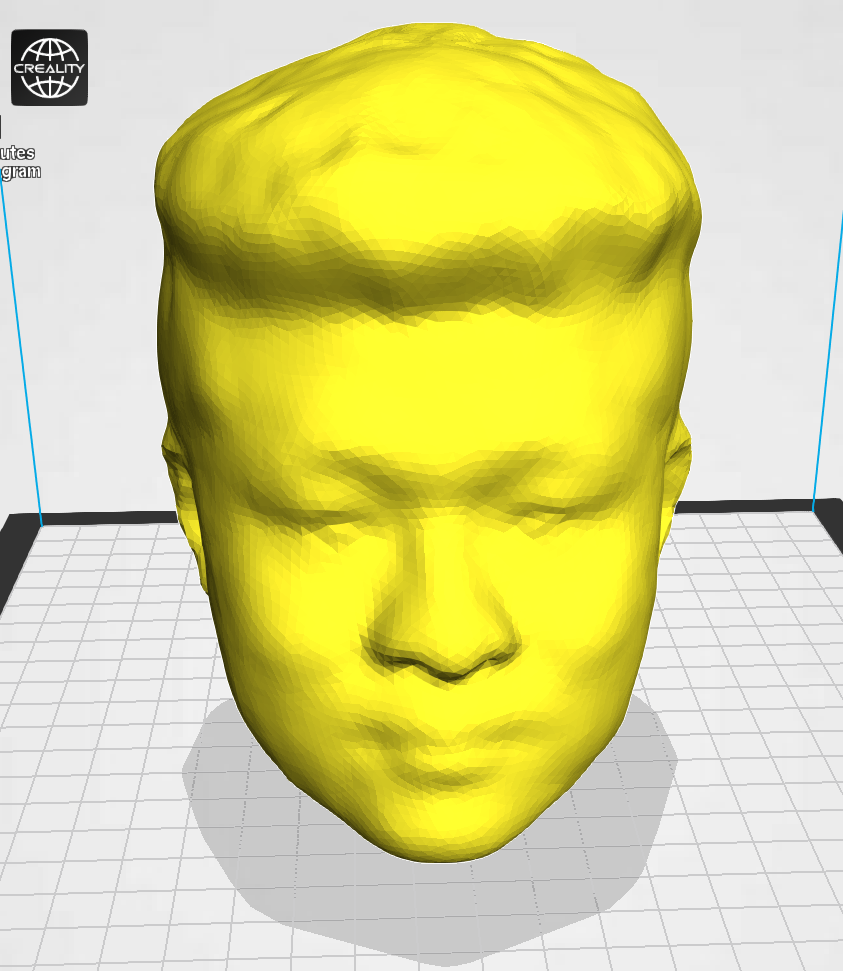
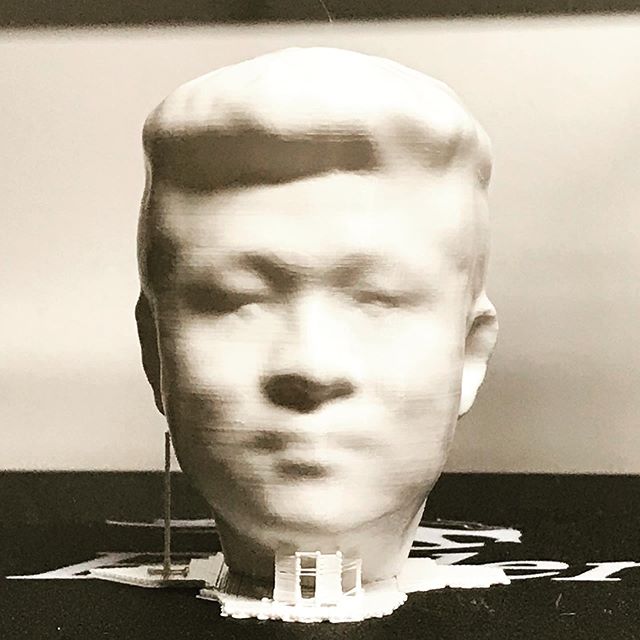
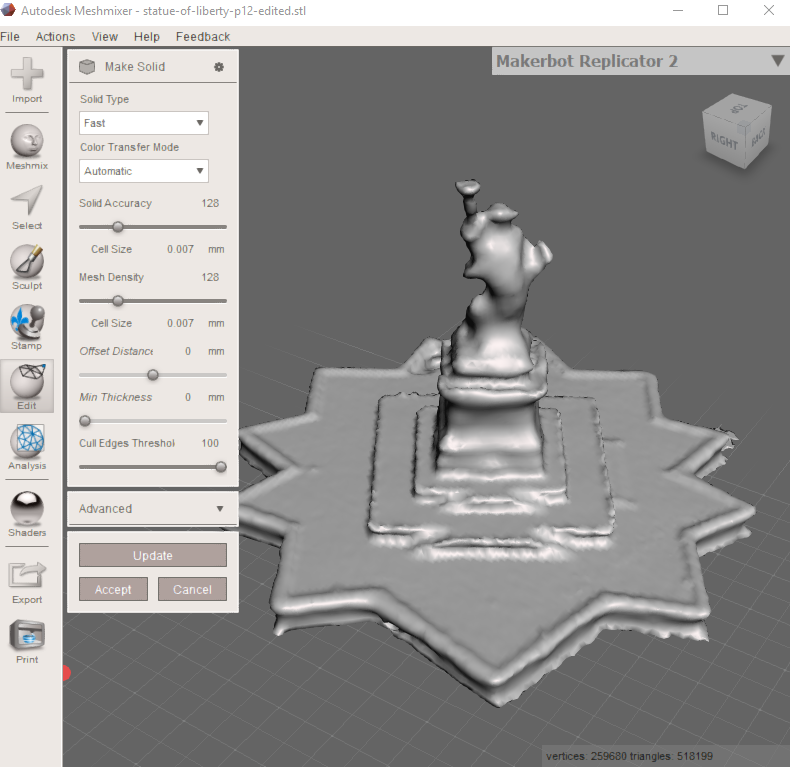
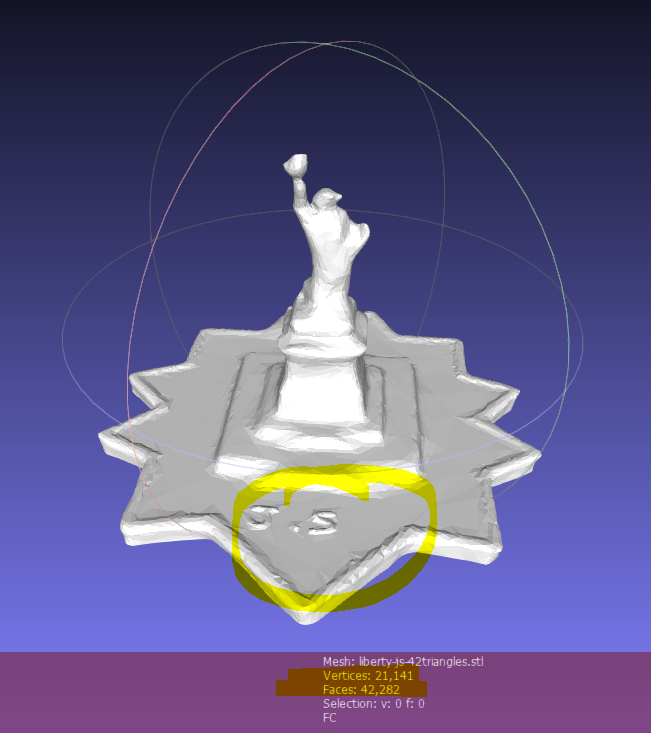
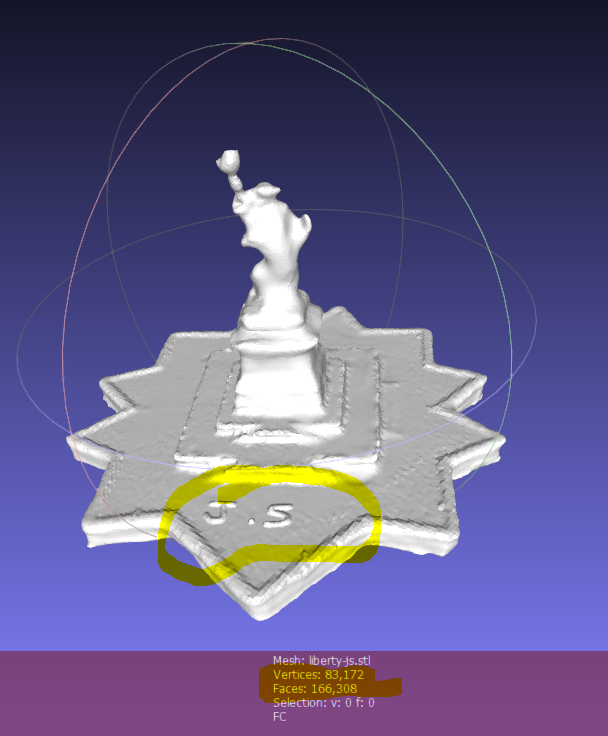
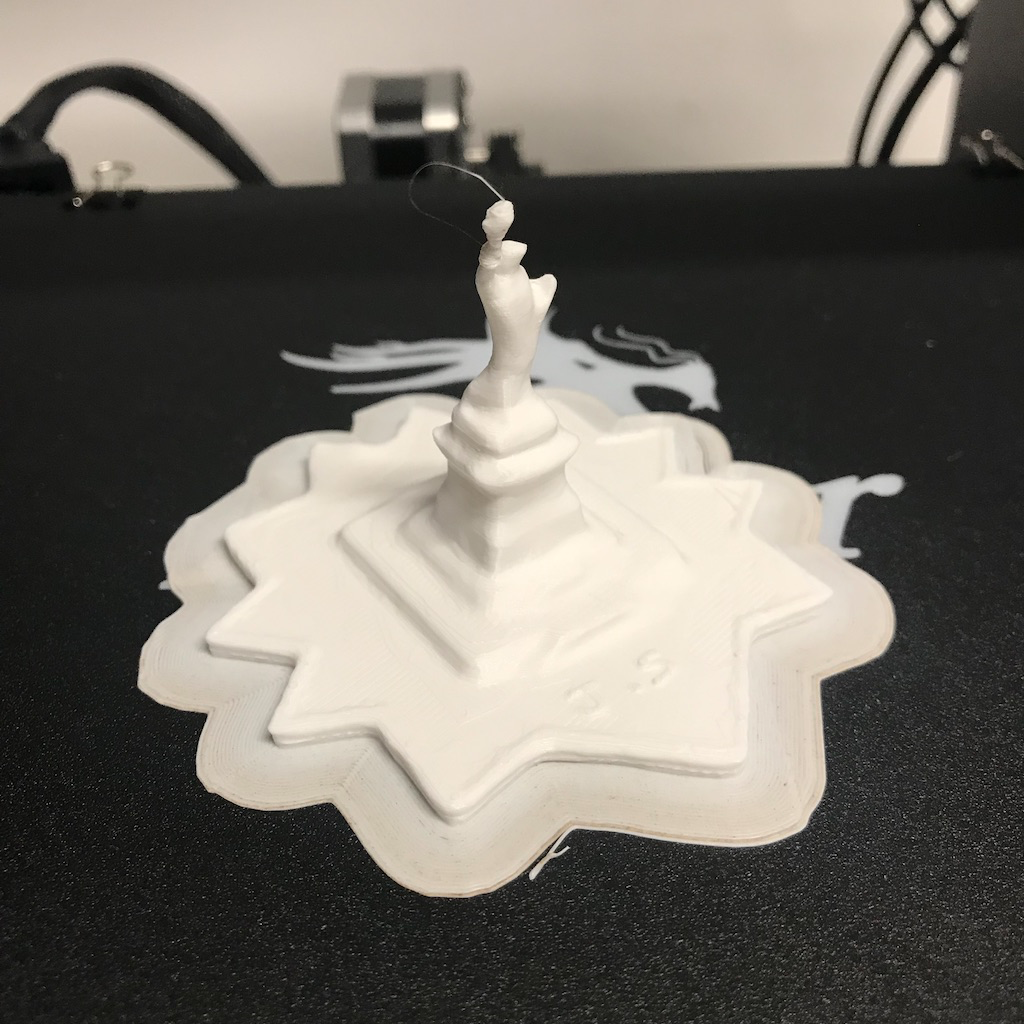
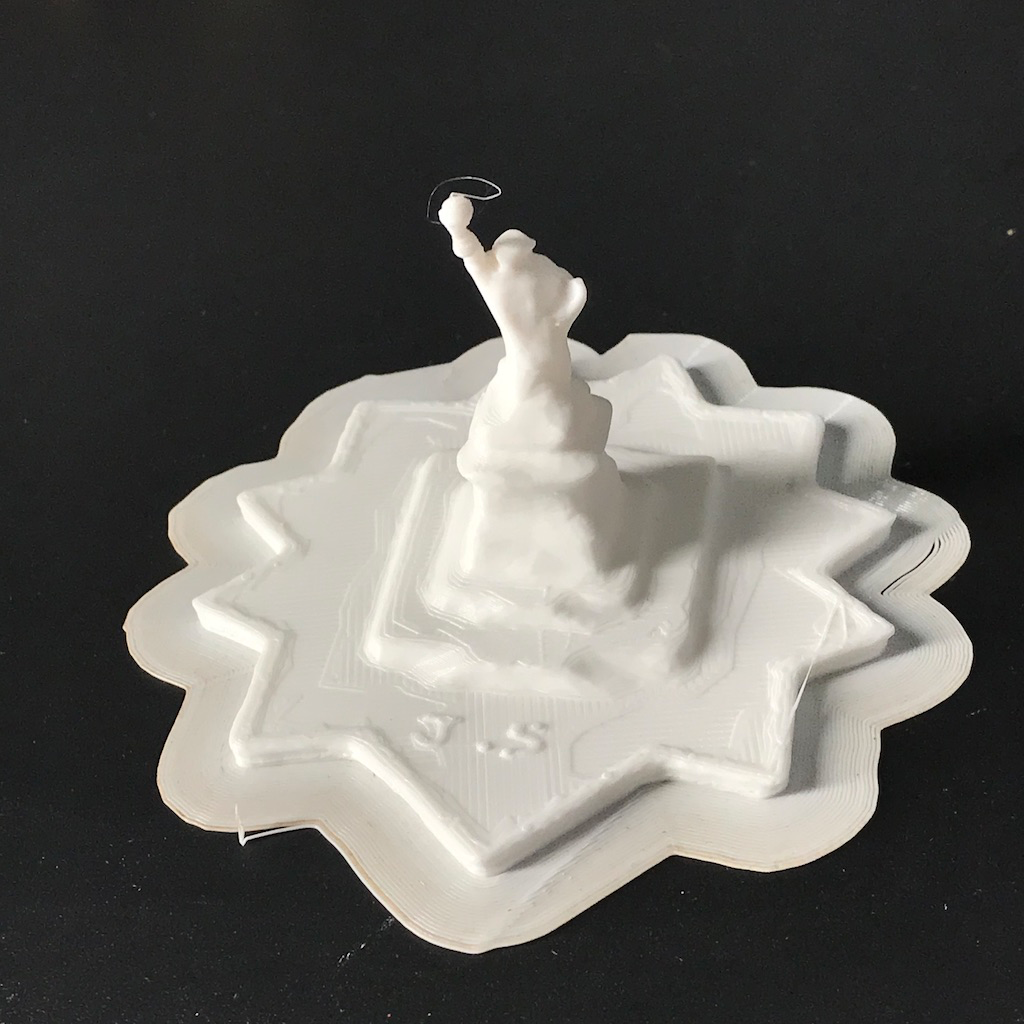
I could import this to Autodesk Meshmixer and 3D print it.
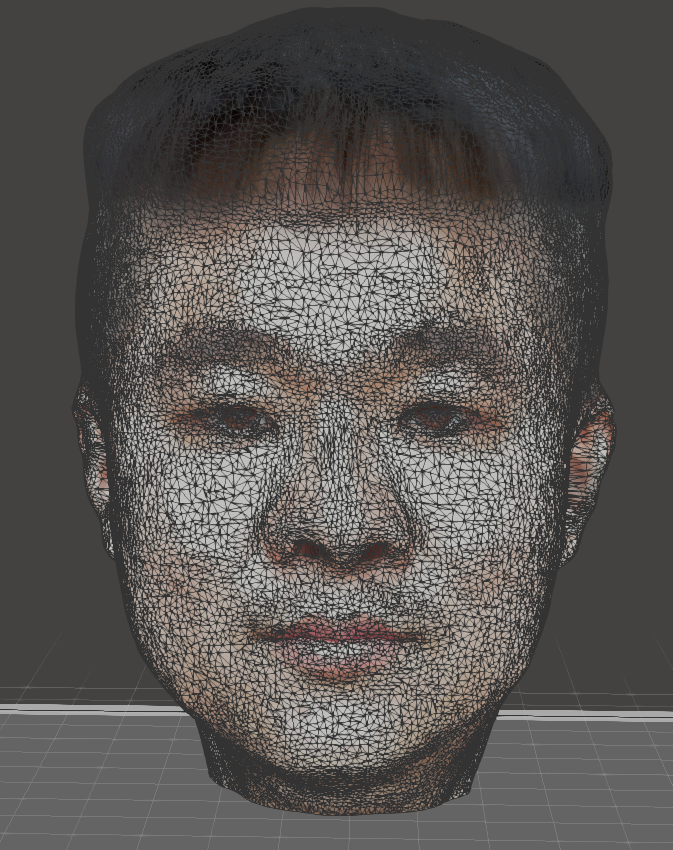
There are 46,000 vertices and 90,000 triangles. My 3d printer isn’t all that accurate, I get an effective resolution of 1.0mm to 1.5mm, so I am going to reduce complexity. It also helps reduce filament threads. See https://re3d.org/reduce-stl-triangles-using-autodesk-meshmixer/
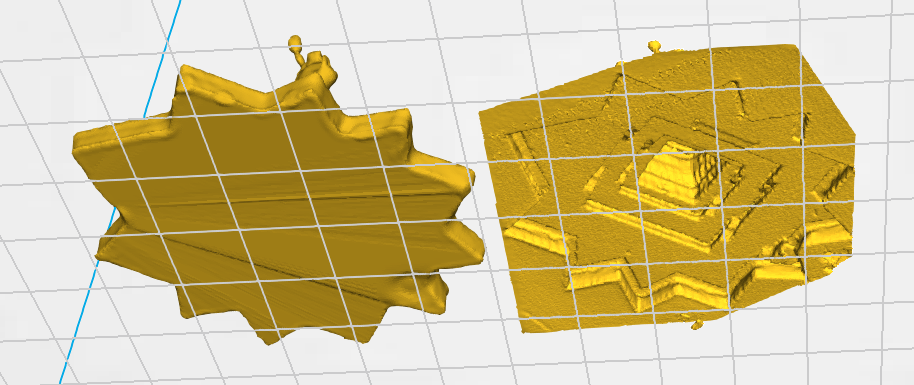
Edit -> Make Solid. Collapse triangle mesh. I use cell size of 1.8mm and mesh density 1.4mm.